 House prices in Ireland
Leaving Certificate Computer Science project
How house prices changed in Ireland, 2011 to 2024
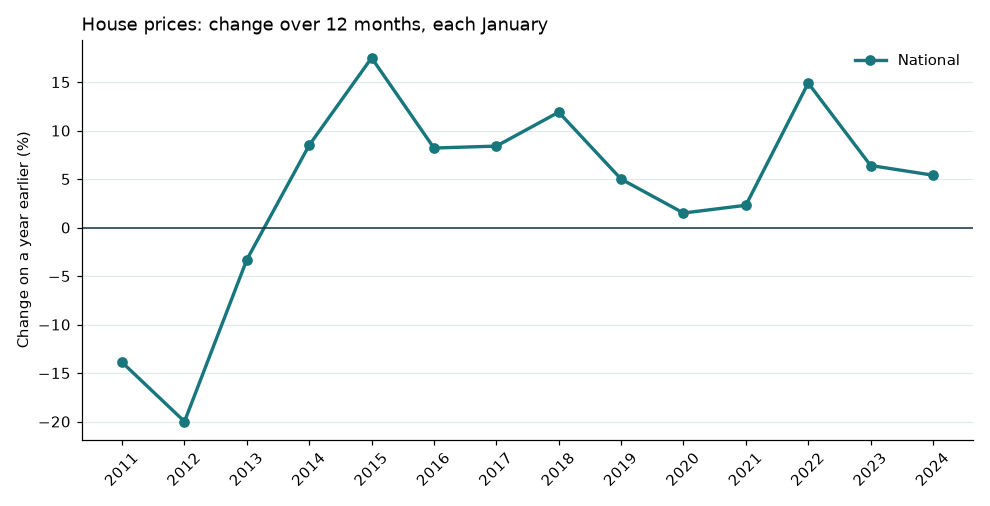
Each January, the Central Statistics Office measures how much house prices changed over the past 12 months. Pick a region to see its figures, and add up to four regions to the graph to compare them.
Choose a region
The first region you pick is described below; up to four are drawn on the graph.
National
Biggest rise: 17.5% in 2015. Biggest fall: -20.0% in 2012.
What do mean, median and mode tell us here?
The mean adds up every year's change and divides by the number of years. The median is the middle value once the years are in order, so one very good or very bad year moves it less. The mode is the value that comes up most often; most regions never repeat a figure, so they have no mode. "Overall" chains the yearly changes together to show how far prices moved in total.
Graph
Year by year
| January | Change on a year earlier |
|---|---|
| 2011 | -13.9% |
| 2012 | -20.0% |
| 2013 | -3.3% |
| 2014 | +8.5% |
| 2015 | +17.5% |
| 2016 | +8.2% |
| 2017 | +8.4% |
| 2018 | +11.9% |
| 2019 | +5.0% |
| 2020 | +1.5% |
| 2021 | +2.3% |
| 2022 | +14.9% |
| 2023 | +6.4% |
| 2024 | +5.4% |